
Business Banking


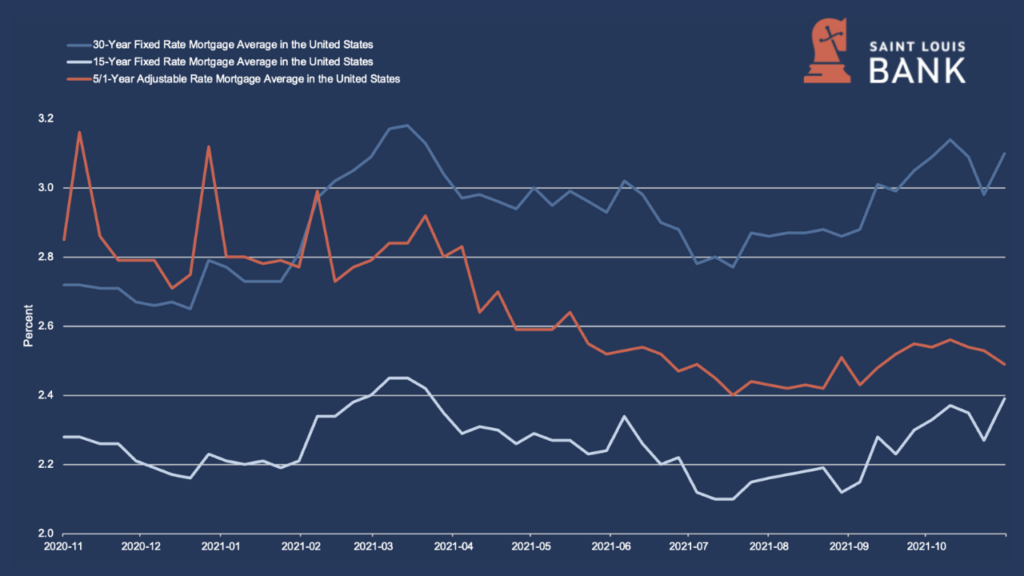
A seasonal slowdown in transaction volume is expected to take place in the residential real estate market inching back to a more normal pace in the coming months. That said, many of the pandemic-instigated pressures on the industry will remain in place. Therefore, while things may calm down a bit, the waters will still be choppy. Some of these pressures include the following.
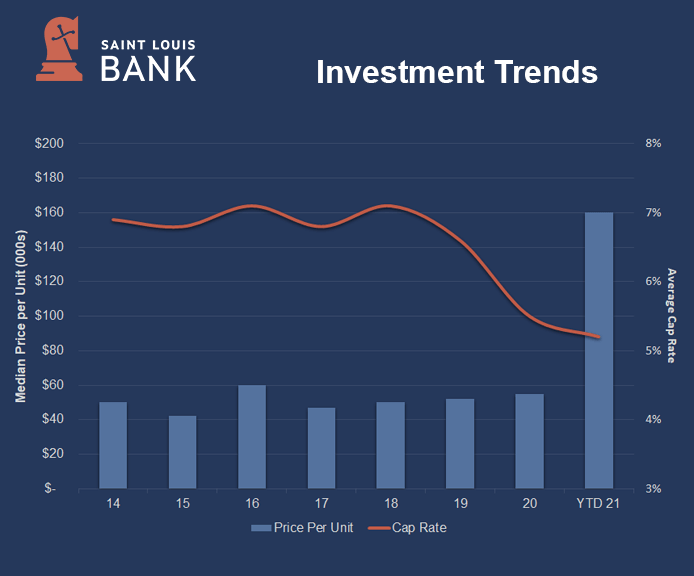
St. Louis’ diverse employment base helped prove its strength during the health crisis, placing it in the “stable markets” pool nationally. Also boosted by an affordable cost of living and low-risk geography, the multi-family market’s performance surpassed pre-pandemic levels. Renter demand has ticked higher, allowing for ongoing rent increases. St. Louis rents rose 1.1% on a trailing three-month basis through August to $1,075, still far behind the $1,539 U.S. average. Multi-family investment activity in the St. Louis area gained momentum in recent months. Investor demand for apartment properties is rising, leading to greater transaction volumes and a rise in prices. During the second quarter of 2021, transaction activity more than doubled levels from the first three months of the year. With interest rates low, and the investment landscape increasingly competitive, cap rates have tightened. Cap rates compressed during the second quarter, bringing the average through the first half of 2021 to 5.4%.
Sources: NorthMarq, Reis
Developers delivered 769 units in 2021 through August, 0.6% of total stock, or less than half the 1.3% national rate. The construction pipeline had 5,223 units underway as of August. Projects under construction are heavily tilted toward the Lifestyle segment (4,288 units), while the Renter-by-Necessity component had just 935 units, 474 of which were in six fully affordable communities. The Lifestyle segment includes renters by choice that have sufficient wealth to own but have chosen to rent. Discretionary households, most typically a retired couple or single professional, have chosen the flexibility associated with renting over the obligations of ownership. All deliveries in 2021 through August were upscale properties, and nearly half were in the Chesterfield submarket. The submarket holds the largest project completed this year through August, the 188-unit Wildhorse. Construction activity was uneven across the map, with the city core remaining the favorite, as about half of the projects underway are located within a 5-mile radius of downtown. Submarkets with the highest number of units under construction include Lafayette Square (870 units), O’Fallon (616 units), and Forest Park (594 units). The largest project under construction as of August 2021 was the 462-unit Reserve at Mid Rivers in St. Peters, slated for completion in 2023.
The pace of sales activity gained momentum during the second quarter. The number of transactions that closed in the second quarter was more than double the levels recorded at the beginning of the year. As competition has intensified, prices have risen; the median price is $159,500 per unit, while cap rates have averaged 5.4% in 2021, a decrease of 20 basis points from the end of 2021.
Sources: NorthMarq, CoStar, Real Capital Analytics
Looking ahead, the St. Louis multi-family market is forecast to become increasingly active for the remainder of 2021. Renter demand should receive a boost from a local labor market that is expected to gain momentum in the coming months, while deliveries are on track to accelerate as new projects work through the development pipeline. The anticipated result of both new supply and organic demand growth should be a modest decline in vacancy during the second half of the year and a continued increase in rents. Investors are expected to continue to seek opportunities in apartment properties in the St. Louis region. Sales in the first half of 2021 included a number of properties built in the past five years, and these properties are changing hands at prices that begin around $200,000 per unit and have topped $275,000 per unit in a few cases. As market fundamentals improve, more properties are likely to change hands, and cap rates could compress further as more buyers look to implement acquisition strategies. Affordability concerns remain on the radar screen given the development concentration in upper-end properties and increasing rent and price pressures.
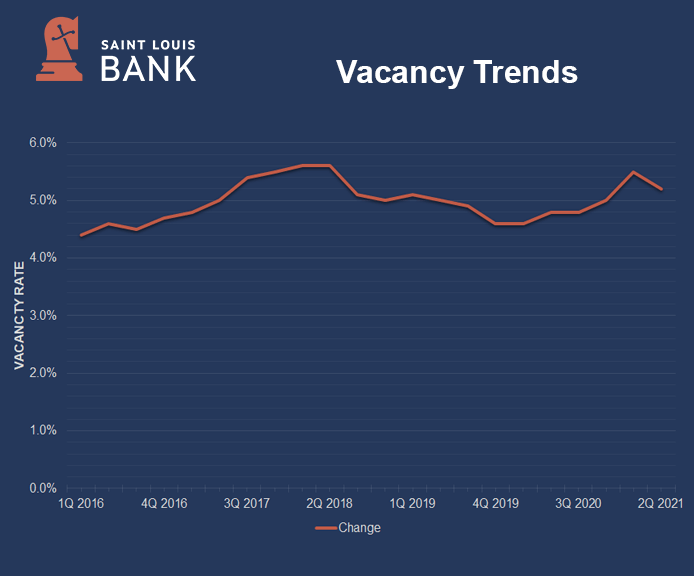
On a national level, the national occupancy average increased 0.6% in the third quarter of 2021 and was up 2.3% year-over-year. The move out of the suburbs in many markets to downtown areas accelerated and newly constructed apartments over the past decade filled to higher occupancies than their pre-pandemic levels. Many Class A, high amenity apartments raised rents as much as 25% over pre-pandemic levels. National average apartment asking rent growth was 3.3% in 3Q21 and up an amazing 11.3% year-over-year. Apartments may end up being the best-performing property type in 2021. Supply and demand in the St. Louis market as well as many Midwest markets such as Chicago, Kansas City, and Indianapolis remain generally in balance with markets such as San Francisco showing signs of excess supply.
Data Sources: St. Louis REALTORS® Housing Report – October 2021; NorthMarq Greater St. Louis Multifamily Market Report – 2Q2021; Yardi Matrix St. Louis Multifamily Market Analysis – Fall 2021; Denver University – Burnes School of Real Estate & Construction Management – Real Estate Market Cycle Monitor – Third Quarter 2021; FRED Economic Data – Federal Reserve Bank of St. Louis; Bankrate.com.
Disclaimer: The views and opinions expressed are those of the authors and do not necessarily reflect the official policy or position of Saint Louis Bank. Any assumptions made in the analysis are not reflective of the position of any other entity other than the author(s), and since we are critically-thinking human beings, these views are always subject to change, revision, and rethinking at any time. The information contained within has been obtained from sources we believe to be reliable; however, we have not conducted any investigation regarding these matters and make no warranty or representation whatsoever regarding the accuracy or completeness of the information provided. While we do not doubt its accuracy, we have not verified it nor make any guarantee, warranty or representation of any kind or nature about it. The use of or reliance upon and resource provided is a tacit acceptance that the reader understands that the materials may be out of date, opinion-based, incorrect, or biased. It is the reader’s responsibility to verify their own facts.
St. Louis Bank is an Equal Housing Lender and Member FDIC.