
Business Banking


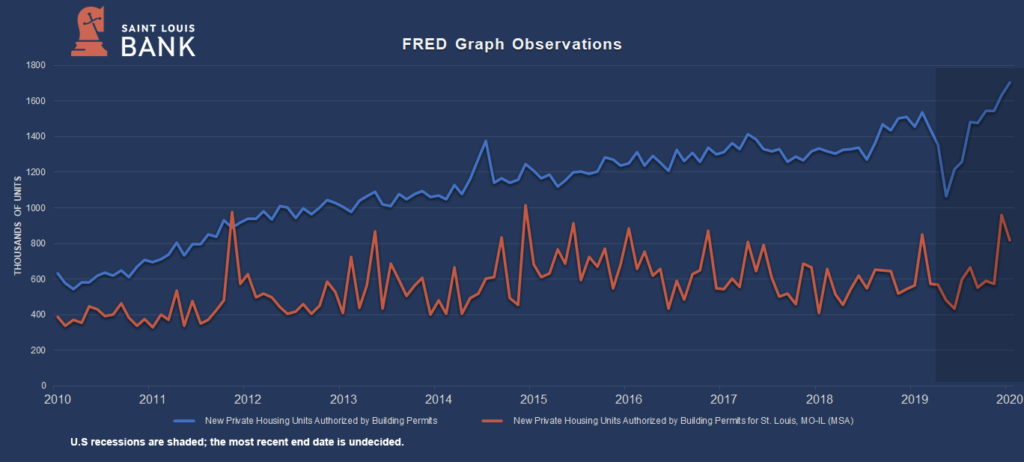
Residential real estate activity in St. Louis remains sound with the market remaining a “seller’s market” boosted by the continued low-interest-rate environment. As illustrated on the chart below, the metro-St. Louis area remains well below national trends as it relates to new housing building permits issued, but after a decrease at the onset of the pandemic, activity levels have consistently risen ending November 2002 at a five-year high. That said, while national trends continued upward, there was a slight retraction in the St. Louis MSA during December.
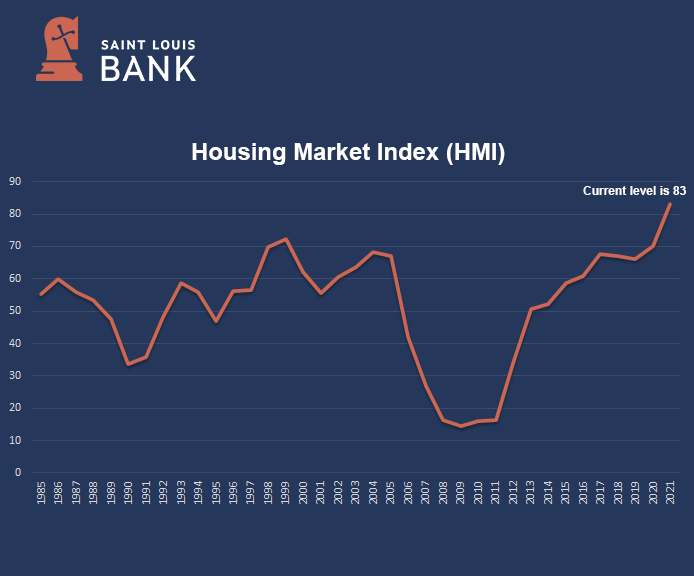
Showing the Housing Market Index, the next chart is also known as builder’s confidence and is a gauge of builder opinion on the relative level of current and future single-family home sales. A reading above 50 indicates a favorable outlook on home sales; below 50 indicates a negative outlook. The index showed a sharp decline from March to May 2020; however, began a sustained rebound in June.
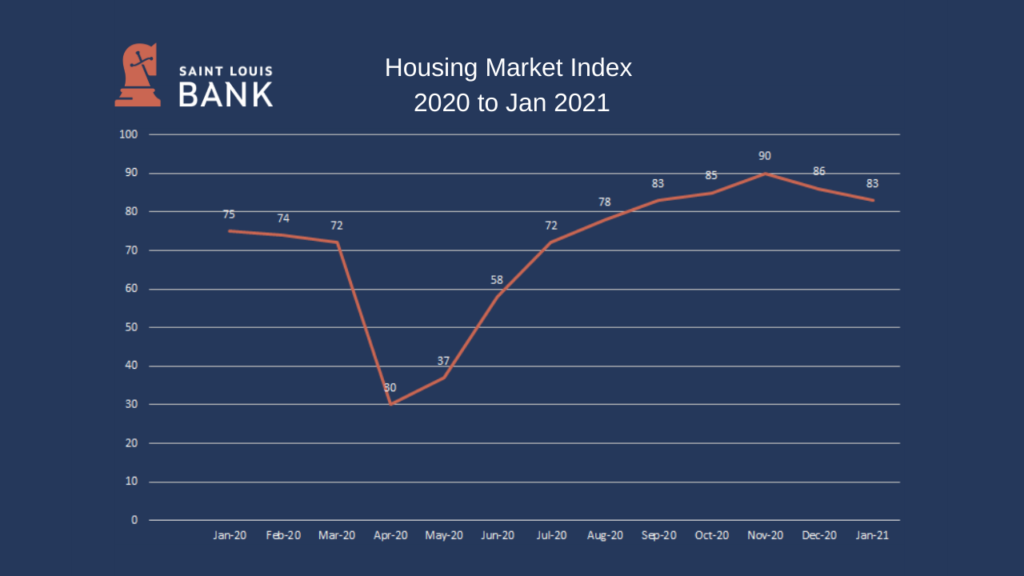
The index peaked in November 2020 at 90, which was the highest in its history, dropping to 83 in January 2021—still well above prior levels.
Housing demand is strong entering 2021; however, the coming year may see housing affordability challenges as inventory remains low and construction costs are rising. Home prices are up due to high demand and short supply. New home pricing faces additional pressure because of rising costs for builders. Low interest rates have given buyers more purchasing power; any bump higher in interest rates could hurt sales significantly.
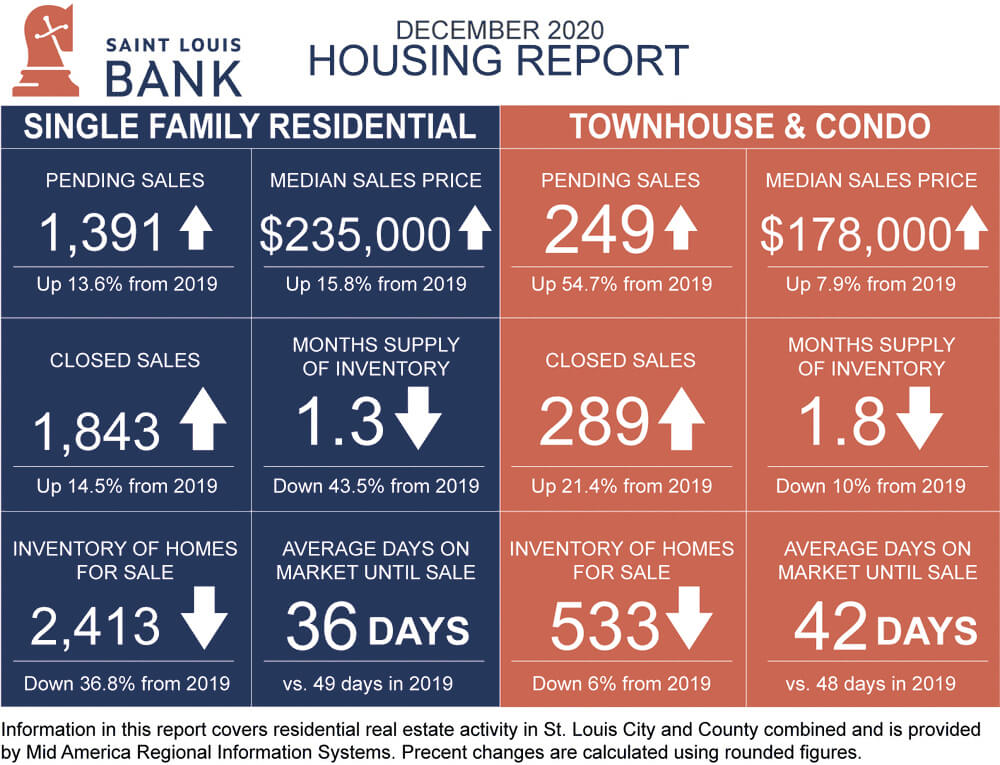
The following data is from the St. Louis Realtors Association reflecting residential activity as of December 2020. December is normally one of the slowest home selling months; however, buyer demand remains strong across most segments of the market. As shown, sales activity has been strong with pending sales increasing significantly from 2019. Median sales price is up 15.8% from 2019 at $235,000 for residential homes, and up 7.9% to $178,000 for townhouse/condo properties. Months’ supply of inventory decreased 43.5% for residential homes and 10% for townhouse/condo homes. With inventory remaining constrained in most market segments, sellers continue to benefit from the tight market conditions.
The St. Louis multi-family market was resilient in 2020. Rents continued to improve, pushing upward by 0.3% on a trailing three-month basis through October, even as growth remained flat at the national level. The average rent of $999, which is 31.7% less than the U.S. average, positions St. Louis well as renter demand continues to shift toward more affordable options. In the third quarter, 840 units were brought to inventory, greatly outpacing the market’s quarterly five-year average in development activity. On the demand side of the market, renters absorbed 784 units between July and September, a stark contrast to the 67 net moveouts recorded during the first half of the year. St. Louis is also among the few Midwest metros experiencing increased renewal and retention rates. As a result, the metro’s average occupancy rate stabilized in the third quarter to 95.0%. At the same time, with the monthly average effective rent reaching $999, the quarterly rental growth rate remains positive. While the fundamentals of this market are sound, federal programs for rental assistance under COVID relief bills are likely to mask some concerns. Under the second stimulus package signed into law on December 27, 2020, the City of St. Louis alone committed over $7 million dollars of CARES Act funds for rental and mortgage assistance. Over 9,000 applications were received and are in process as of this writing.
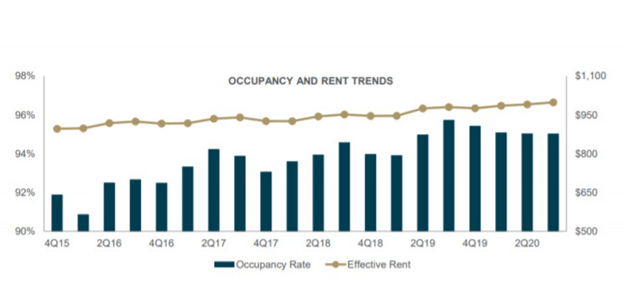
Chart Source: Berkadia Third Quarter 2020 St. Louis Multi-Family Report
Investment picked up in 2020, with transactions totaling $484 million through October, a nearly 35% increase from the same period last year. Per-unit prices jumped to $123,068, a 71% increase compared to 2019. However, even amid investment activity expansion, development has slowed. Fewer than 1,000 units were delivered in the first 10 months of the year, and an additional 2,239 were underway, nearly all aimed at Lifestyle renters. Few projects are expected to break ground in the coming months.
This sector of the economy will be impacted by the novel coronavirus. Besides unemployment, additional challenges may be on the horizon as state and local governments face decreasing tax revenues, budget cuts, and reduced public spending, leading to a slower or delayed recovery. As with the other sectors, it is difficult to provide an accurate forecast of the current market because it is unknown how deep the impact will be on the St. Louis economy.
Data Sources: FRED Economic Data, The St. Louis Association of Realtors, Advisor Perspectives, Berkadia St. Louis Multi-Family Report – Third Quarter 2020, Yardi Matrix Fall 2020
Disclaimer: The views and opinions expressed herein are those of the authors and do not necessarily reflect the official policy or position of Saint Louis Bank. Any assumptions made in the analysis are not reflective of the position of any other entity other than the author(s), and since we are critically-thinking human beings, these views are always subject to change, revision, and rethinking at any time. The information contained within has been obtained from sources we believe to be reliable; however, we have not conducted any investigation regarding these matters and make no warranty or representation whatsoever regarding the accuracy or completeness of the information provided. While we do not doubt its accuracy, we have not verified it nor make any guarantee, warranty, or representation of any kind or nature about it. The use of or reliance upon and resource provided is a tacit acceptance that the reader understands that the materials may be out of date, opinion-based, incorrect, or biased. It is the reader’s responsibility to verify their own facts.
Saint Louis Bank is an Equal Housing Lender and Member FDIC.