
Business Banking


We separate our commercial report into three sections: Industrial, Office, and Retail. Each sector differs in its challenges and recovery from the COVID-19 pandemic. While we are beginning to see some traction on a return to normal, it is likely that a new normal for many will be more prevalent.
Prior to the pandemic, the industrial real estate market, which includes warehouses and distribution centers was already strong. The fundamentals were pushed even stronger throughout 2021. Among the factors affecting the surge were the shift to online shopping last year and third party-logistic providers looking to expand their footprints to accommodate this trend. Acute changes from the retail consumer are spurring massive changes in institutional investing, warehouse design, and supply chains. These changes will be felt for years to come. Further, as a global economy with substantial reliance on goods being manufactured abroad, pressure on critical supply hubs made the supply chain a hot topic. Industries that are reliant on getting goods from critical supply chain nodes, like ports, experienced delays impacting their business which forced a rethinking of inventory management. For the industrial real estate market, this resulted in a spike in demand for warehouse and storage space. Demand continues to outpace supply with the lack of available space contributing to rents being driven up and vacancy hitting record lows.
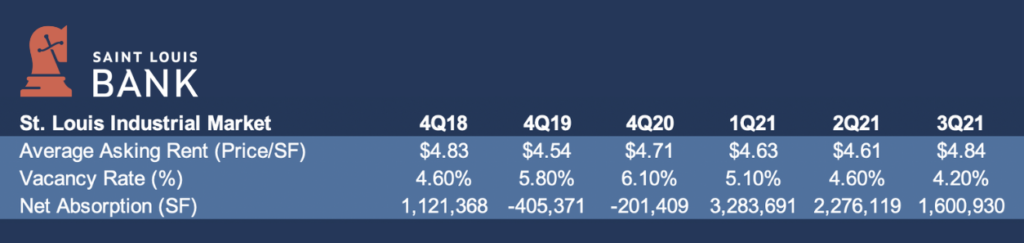
The St. Louis industrial sector tightened in the third quarter of 2021. During this period, the market realized positive absorption of 1.6 million square feet, the fifth highest quarterly absorption since third-quarter 2017. Overall vacancy decreased 40 basis points from the prior quarter to 4.2%, while average quoted rents significantly increased from $4.61 per square foot to $4.84 per square foot. Three properties delivered 1.6 million square feet of product to the market during the quarter: the 811,300 square foot building for Medline in the Premier 370 Business Park, the 412,500 square foot Hazelwood TradePort V building in Hazelwood TradePort, and the 144,800 square foot Building VII for Amazon in Fenton Logistics Park. Developments under construction slightly decreased to 2.5 million square feet.
The market set a decade-old record for the largest total net absorption during three consecutive quarters with a total of 7.3 million square feet. Net absorption totaled 7.4 million square feet for the past four quarters, equating to a 72.4% increase from the annual average net absorption of 4.3 million square feet during the previous five years. With market vacancy at 4.2%, the following major projects are currently under construction:
St. Louis has untapped development potential compared to other Midwestern markets. The St. Louis industrial sector enjoyed record-setting leasing activity year-to-date as a total of 7.4 million square feet were absorbed, significantly outpacing the quarterly average of 617,036 square feet during the previous three years. Among Midwestern industrial markets, St. Louis posted the second-lowest vacancy rate and ranked 15th in the U. S. for the highest percentage of net absorption to total market size among the most active markets in the nation. As the 19th largest industrial market in the U.S., St. Louis has untapped development potential compared to other Midwestern markets. St. Louis ranked 16th in 12-month deliveries to total market size. In addition, St. Louis ranked 17th in under construction square footage to total market size.
The pandemic highlighted the fact that many businesses were too reliant on foreign manufacturing and importation. As manufacturers shift away from importing, these businesses will be better positioned to minimize overall supply chain issues. Since businesses cannot diversify their suppliers overnight, the demand for expansion could continue over the next three to five years, strengthening the industrial sector as businesses explore more domestic options. Demand for space only increased as many industrial real estate users have recognized a need to hold “just in case” inventory to keep their business operations running.
Investor Demand Mirrors Occupier Demand. Nationally, from 2017 to 2019, the institutional investment community significantly increased their industrial investment allocations. This trend accelerated after the start of the COVID-19 pandemic, with a 10.6% increase in 2020 and a 10.9% increase in the first half of 2021. The flow of capital into the industrial sector has largely provided solutions to the backlog of industrial demand. However, land and building prices have increased significantly. For example, the average single asset deal price increased over 20.6%, from $16 million in the first quarter of 2020 to $19.1 million in the first quarter of 2021. These price increases will undoubtably increase rents and, perhaps, consumer prices. However, increased capital flows into the industrial sector will make possible the tectonic shifts necessary to transform the e-commerce distribution network to an efficient, labor-friendly, and sustainable supply chain.
Could a new port be on the way for the St. Louis area? In December 2021, Hawtex Development Corporation announced that they plan to build a new cargo port on more than 300 acres in Jefferson County that will handle container ships coming up the Mississippi River, a move that could help alleviate supply chain challenges at coastal ports. Should it come to fruition, the port would be a material development in the industrial market of the St. Louis region. The total amount of investment at the port is still to be determined since the facility is in the early stages of development, but certainly a project to watch.
Foot traffic in office buildings has improved in recent months with more than one-third of workers returning to offices as of October 2021, but uncertainty around new variants of the virus has many companies delaying their return to office plans into 2022. Even with a more gradual re-entry process and potentially more balanced hybrid plans than initially expected, the crucial role that physical offices play in fostering corporate culture, productivity, and innovation will underline the longer-term need for space that meets evolving tenant and employee preferences. Conditions will remain tenant-favorable for the foreseeable future, while the flight to quality and an accelerated rate of relocations to newer supply will lead to an even greater divergence in performance across office assets.
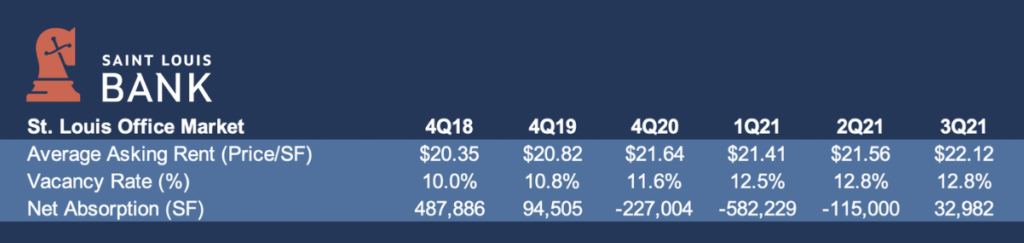
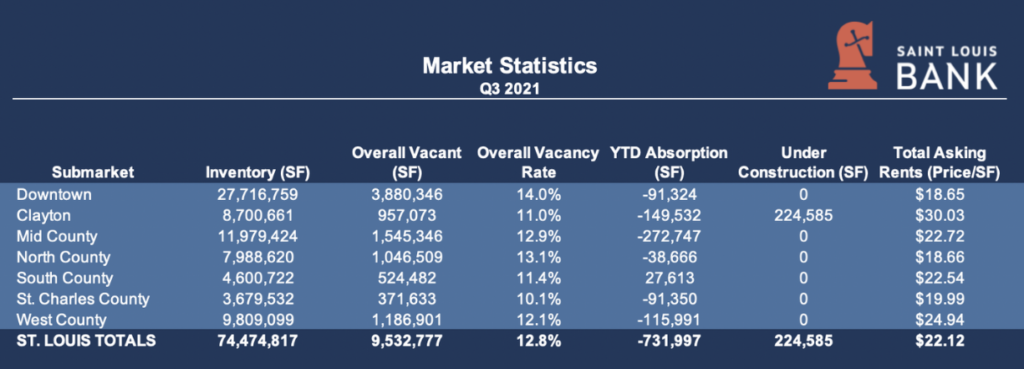
The St. Louis office market realized an increase in asking rental rates in the third quarter of 2021. Rents climbed to another record high of $22.12 per square foot, up to $0.55 per square foot from the second quarter of 2021. Market vacancy remained flat at 12.8% from the prior quarter. However, the current vacancy level represents an increase of 160 basis points from one year ago. Total net absorption in the quarter measured 32,982 square feet, bringing the total for the past four quarters to negative 1.1 million square feet. One construction project underway during the quarter totaled 224,585 square feet. The Class A, Forsyth Pointe project in Clayton is currently 42.6% pre-leased. No projects were delivered to the market during the quarter.
Concessions and longer lease terms continue to push asking rental rates upwards as the office market tightened. Concessions, in the form of abated rent and additional tenant improvement allowances, offset by longer lease terms, continue to assist in driving asking rental rates upwards. Leasing commitments during the quarter were active in various submarkets as tenants locked in favorable terms for new direct and subleased spaces. Users in the financial, technology, and health sectors led the quarter. Expect favorable conditions and opportunities for prospective tenants to upgrade from Class B to Class A space during this time as submarkets in the Metro display vacancy rates for Class A space ranging from 9.9% to 26.1%.
On a national basis, the office market occupancy level was down 1.4% year-over-year. Many second-tier markets in the sunbelt and west appear to have turned the corner with leasing activity increasing by 8% providing occupancy increases, while many top-tier “gateway” markets were still seeing occupancy decreases. The move from high cost “gateway” east and west coast markets to the lower cost of living, second-tier markets seem to have been accelerated by COVID. As with the St. Louis region, many tenants are choosing Class A properties with lots of amenities, as firms try to make coming back to work as attractive as possible for employees. Newer properties are also commanding a rent premium almost twice the pre-pandemic premium rates offered.
The office market could continue to be a mixed bag. While some companies have started bringing people back into the office, the list of those who have not – including major employers – is long and probably won’t shrink much, given the continued uncertainty of COVID-19 and the effect of its variants. A report from PwC and ULI says that almost two-thirds of real estate professionals believe that fewer than 75% of workers will be there in person at least three days in 2022, and that office space utilization will likely decrease between 5% and 15% through 2024.
Evolving technology, shifting consumer spending habits and supply-chain disruptions highlight many of the challenges retailers are confronting today. As the retail sector includes numerous categories – many of which were subject to widespread government restrictions – it was undoubtedly hit hard during the pandemic. However, certain sub-sectors of retail such as grocery-anchored or necessity-based retail have proven to be resilient. Overall space is gradually returning to normal as everyone better understands and embraces safety protocols. Convenience has become king, and e-commerce necessity-based retail accommodates that in many ways. Adaptation in today’s retail environment is vital.
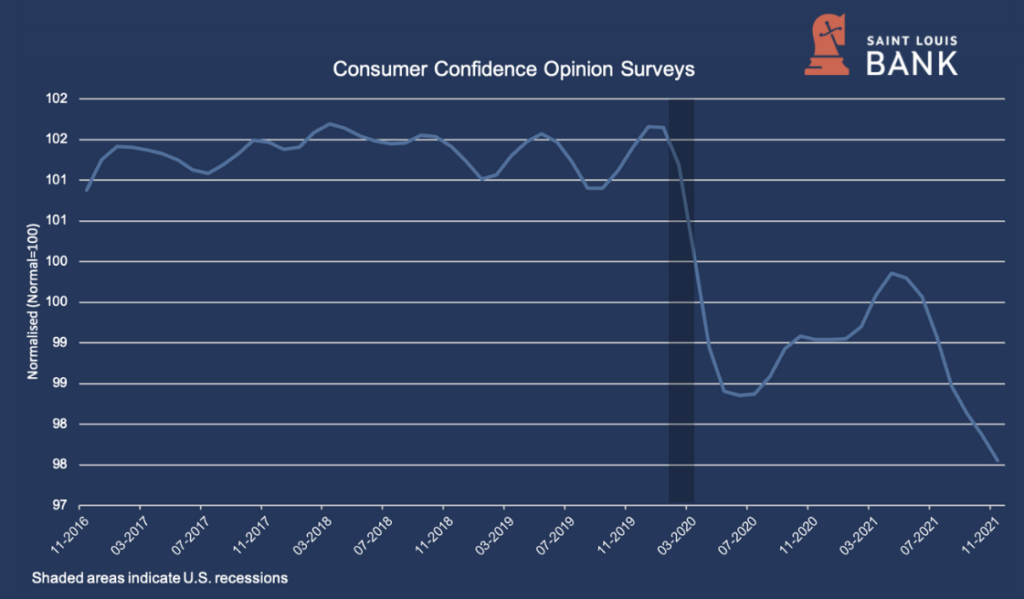
There is now an increasing demand for omnichannel retail, which offers a hybrid experience of online and brick-and-mortar shopping as consumers are saying “more of both.” Despite an elevated inflation environment, concerns about the Omicron variant, and heightened market volatility; retail sales have tracked upward. Retail holiday sales jumped nearly 11% this past season compared with the holiday period in 2019, a year before the pandemic upended the global economy. Even more startling when compared to 2019, e-commerce sales jumped over 61%. As shown below, consumer confidence continues to trend downward which may indicate a more cautious approach in future periods.
As it relates to retail real estate, physical stores have proven to be a very important part of the supply chain and will continue to morph and adapt to fulfill their role in a diversified supply chain. Though more people are shopping online than ever before, many consumers prefer well-positioned neighborhood shopping centers that fit into their routine traffic patterns. For some retailers, finding competitive space could also be an issue as tenants are not choosing the cheapest rent locations. Instead, retailers want the best property with bigger name co-tenants that will drive traffic. If the pandemic continues to slow the growth of new builds, the strongest – not the cheapest – locations will become most competitive.
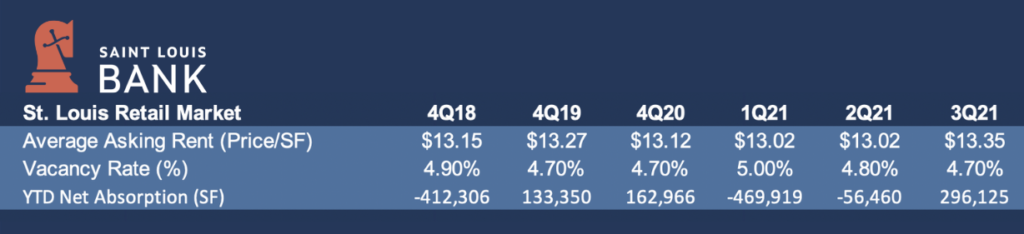
The overall St. Louis retail market loosened year-over-year in the third quarter of 2021, realizing a 10-basis point increase in vacancy to 4.7%. Net absorption totaled 153,680 square feet for the past four quarters and 534,713 square feet for the past two years. The average quoted rental rate is $13.35 per square foot, down $0.28 per square foot from one year ago.
Data Sources: Newmark Zimmer St. Louis Industrial Market Research Report Q3 2021; Newmark Zimmer St. Louis Office Market Research Report Q3 2021; Newmark Zimmer St. Louis Retail Research Report Q3 2021; JLL Retail Outlook, United States Q3 2021; Denver University – Burnes School of Real Estate & Construction Management – Real Estate Market Cycle Monitor – Third Quarter 2021; FRED Economic Data – Federal Reserve Bank of St. Louis; St. Louis Business Journal, The New York Times.
Disclaimer: The views and opinions expressed are those of the authors and do not necessarily reflect the official policy or position of Saint Louis Bank. Any assumptions made in the analysis are not reflective of the position of any other entity other than the author(s), and since we are critically thinking human beings, these views are always subject to change, revision, and rethinking at any time. The information contained within has been obtained from sources we believe to be reliable; however, we have not conducted any investigation regarding these matters and make no warranty or representation whatsoever regarding the accuracy or completeness of the information provided. While we do not doubt its accuracy, we have not verified it nor make any guarantee, warranty or representation of any kind or nature about it. The use of or reliance upon and resource provided is a tacit acceptance that the reader understands that the materials may be out of date, opinion-based, incorrect, or biased. It is the reader’s responsibility to verify their own facts.
St. Louis Bank is an Equal Housing Lender and Member FDIC.